Why Your LLM Gets Slower at 3pm
#48:17 video6 min readcoming soon
#llm-latency#ttft#time-to-first-token#continuous-batching#paged-attention#kv-cache
Chapters
Each chapter opens the video at its time once the video is on YouTube.
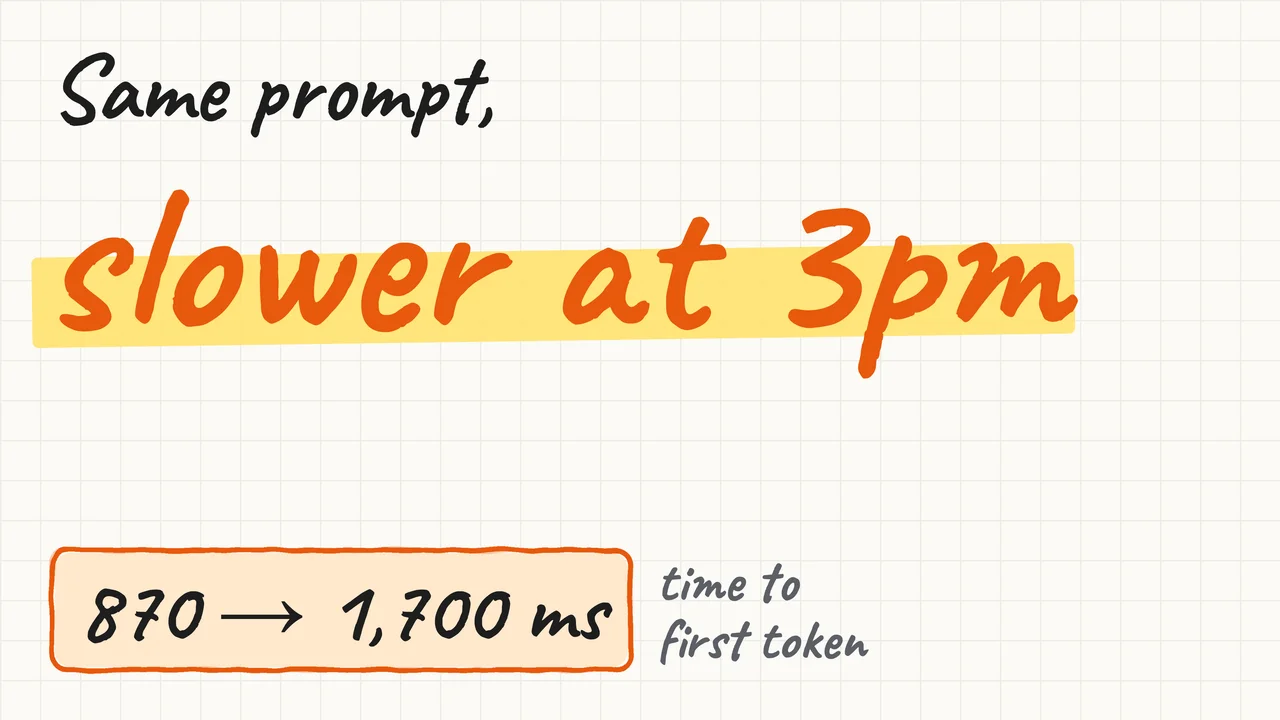
Your support agent's mean time to first token (TTFT) is 870 ms in the morning and about 1,700 ms at 3pm. The prompt, the code and the API key did not change. This video follows the request into the inference server to find what did change, and which plot shows it.
Read it instead
The full lesson in writing, with the diagrams from the video, for anyone who prefers to read.
Your support agent's mean TTFT, the time until the first token of the answer arrives, is 870 ms in the morning. At 3pm it is about 1,700 ms, and your prompt, your code and your API key did not change. So what changed at 3pm, and which plot would have shown you the cause?
Two questions follow: who else is in your batch, and how many requests fit.
1. Who else is in your batch?#
The extra wait comes from inside the server, because one scheduler iteration gives every running request one token. So your latency depends on what else is in the batch, and your prompt is only one part of it.
The situation#
Your support agent sends the same prompt all day to an inference server that other users share. Your logs show the same bytes, rate and key, so nothing on your side explains the slower answer.
The picture#
A server never runs one request alone, because it runs a loop over a batch of requests from many users. Prefill is the pass that reads your whole prompt and makes the first token, and decode is each later pass. Each iteration is one forward pass, one run of the model over the batch, and gives each decoding request one token. Then finished requests leave, waiting requests can join, and the loop starts again.
Think it through#
At 3pm your prompt is the same, and so is the model behind it. So why does its first token arrive almost twice as late?
A first thought is that the request was unlucky, so a retry will land on a faster moment.
That is reasonable for a network error, but it misses that the request spent the extra time waiting inside the server.
So the real question is what decides how long a request waits for its first pass.
The mechanism, step by step#
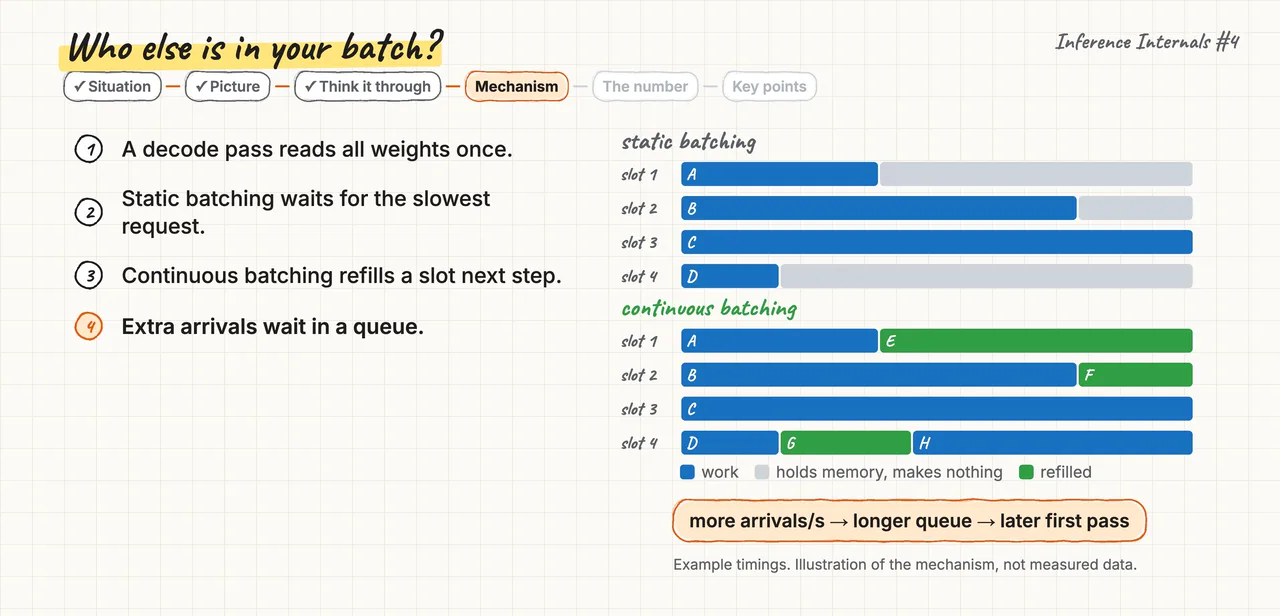
- Each decode pass reads all the weights, the numbers that make up the model, from GPU memory once. In a teaching cost model, a batch of 16 takes 19.92 ms and a batch of 1 takes 18.12 ms. So 16 times the tokens cost only 10% more time, and that is why throughput comes from batch size.
- Static batching, the old way, admits nothing new until the slowest request finishes, so finished slots sit idle.
- Continuous batching admits new work on every iteration, so a finished request's slot is refilled on the next step.
- Each iteration takes only work that fits its token and memory budgets, so extra arrivals wait in a queue.
The number#
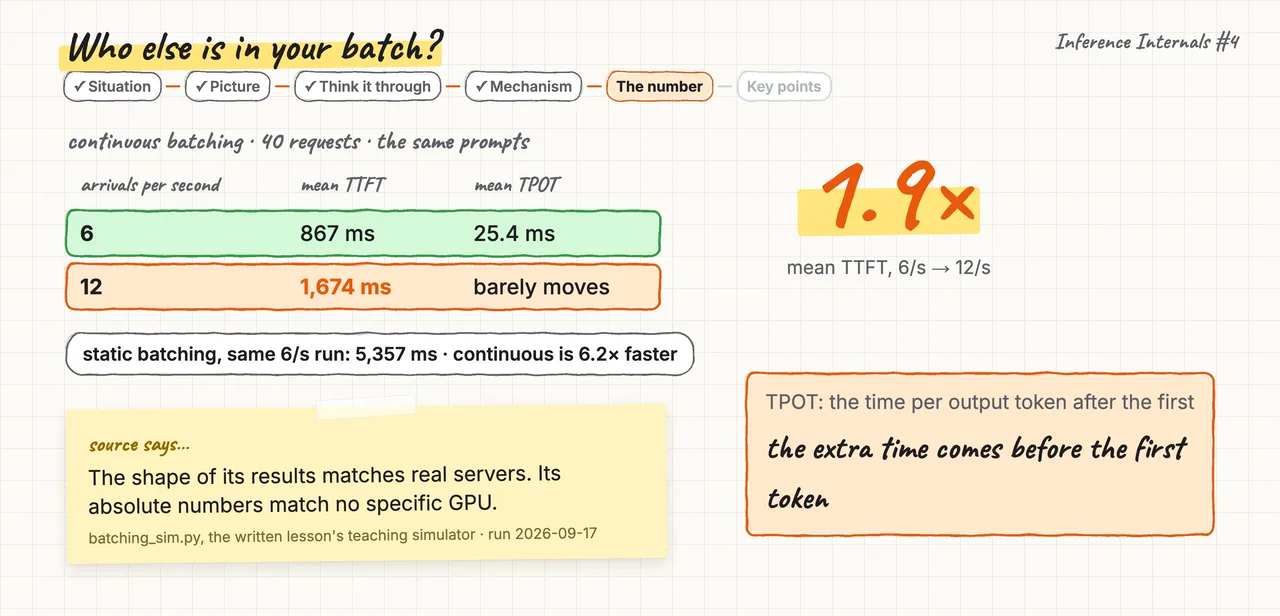
A teaching simulator sent 40 requests at 6 arrivals per second, and continuous batching gave a mean TTFT of 867 ms. Static batching gave 5,357 ms on the same run, so continuous batching is already 6.2 times faster to the first token. At 12 arrivals per second, with the same prompts, mean TTFT rose to 1,674 ms, 1.9 times as long. Mean TPOT, the time per output token after the first, barely moves, so the extra time comes before the first token.
Key points#
- Remember. Throughput comes from batch size, and your latency comes from what else is in the batch.
- The trap. A retry adds one more request to the same queue, so under load the spike gets worse.
- Try this. Send eight copies of one prompt at once, and compare their TTFT spread with eight sent one by one.
A slot in the batch is only half of what a request holds, because it also keeps memory on the GPU. At 3pm that memory decides how many requests run at once, and how many wait in the queue.
2. How many requests fit?#
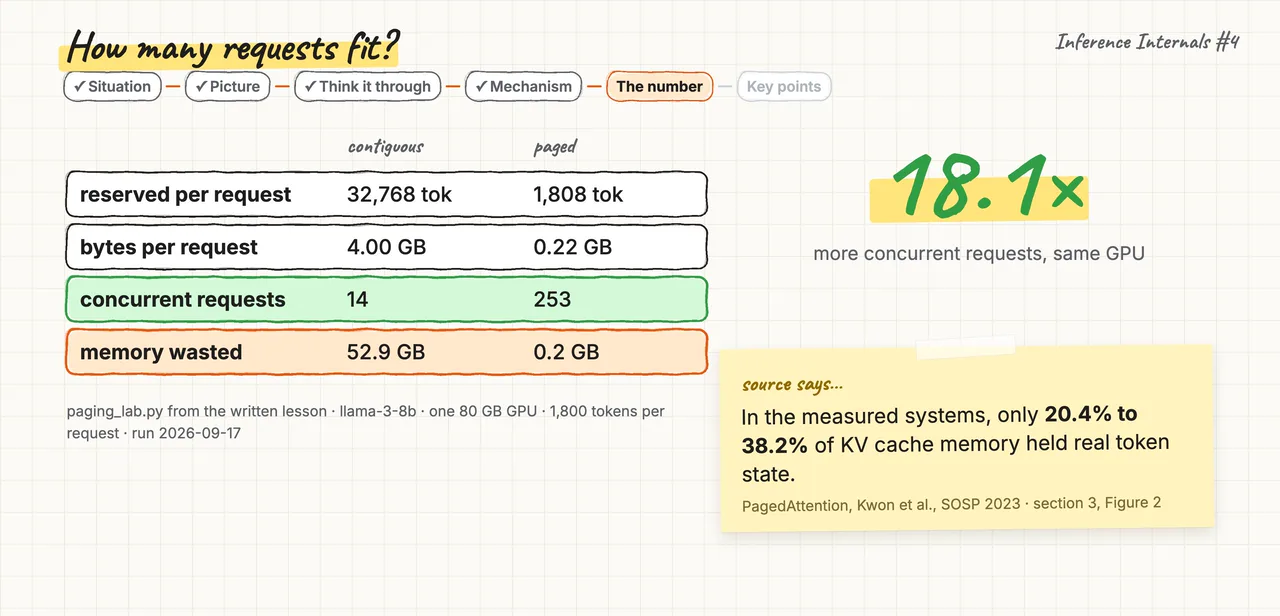
How many requests run at once depends on how the server hands out memory, and paging changed that number. Paging reserves only the memory a request needs now, so one GPU holds 253 requests instead of 14.
The situation#
Take a server like the one behind your API, with llama-3-8b on one 80 GB GPU and 56 GB for request memory. Each support request holds about 1,800 tokens, and the number that fit decides how long the next one waits.
The picture#
The KV cache is the attention keys and values kept for every token of a running request, read on each decode step. The simple allocator reserves one continuous region per request, sized for the longest sequence the server accepts. Paging cuts the memory into small equal blocks, and a block table maps each request's positions to free blocks anywhere. A block is handed out only when the request needs it, so nothing is reserved for the future.
Think it through#
The server does not know how long an answer will be. So how much memory should it reserve for one request?
A first thought is to reserve the longest sequence, so a request can never run out halfway.
That is reasonable, but it misses that most of the reservation stays empty, and no other request can use it.
So the real question is how many requests fit when memory is handed out one small block at a time.
The mechanism, step by step#
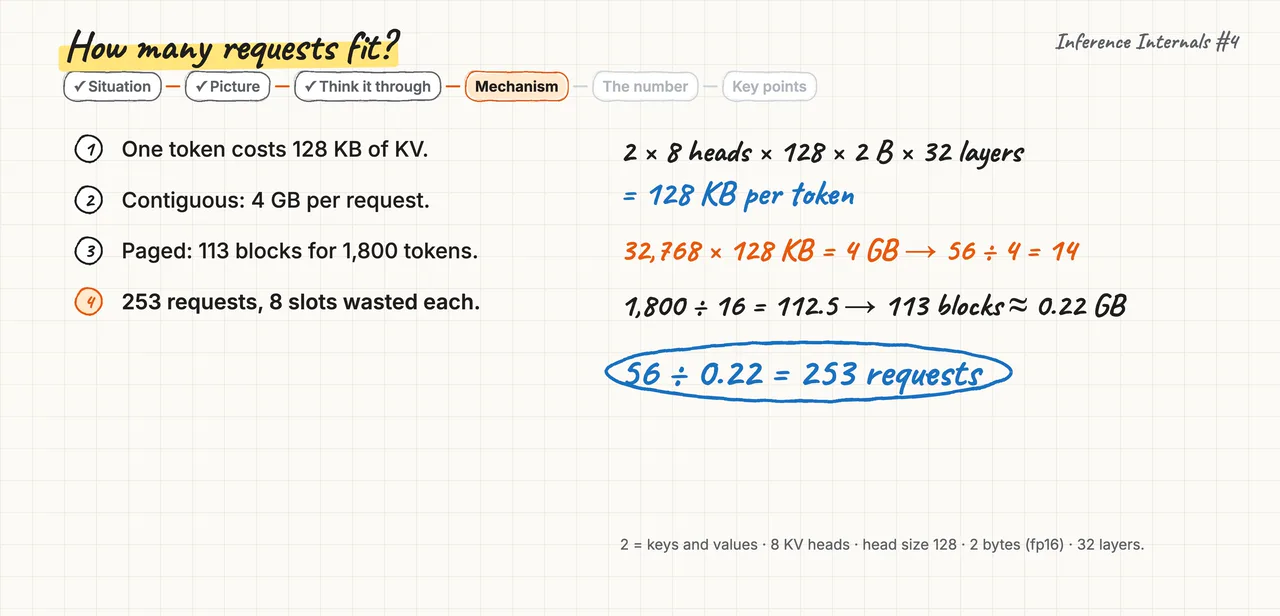
- One token of llama-3-8b costs 128 KB of keys and values, across its 32 layers.
- A reservation of 32,768 tokens then costs 4 GB, so the 56 GB pool holds only 14 requests.
- A paged request of 1,800 tokens takes 113 blocks of 16 tokens, which is about 0.22 GB.
- The pool then holds 253 requests, and each one wastes only 8 token slots in its last block.
The number#
A paging lab with these numbers reports 253 requests against 14, which is 18.1 times more on the same GPU. The reserving allocator leaves 52.9 GB reserved and unused, and paging leaves only 0.2 GB. The PagedAttention paper saw the same waste in real systems, where only 20 to 38% of KV memory held real tokens.
Key points#
- Remember. Paging reserves what a request needs now, not the most it could ever need.
- The trap. A worst-case reservation looks safe, but it leaves 52.9 of 56 GB idle and stops at 14 requests.
- Try this. Count your average request in 2 MB blocks of 16 tokens, and divide the 56 GB pool by it.
At 3pm more requests are running at once, so more of the blocks in that pool are taken. When more requests arrive than the pool can hold, the rest wait in the queue before their first pass.
So what changed at 3pm?#
Back at 3pm, your prompt did not change, so the extra wait came from other people's traffic. It reaches your request in two ways, through the batch and through the memory pool. More arrivals per second put more requests in each batch and in the queue, so your first pass starts later. The memory pool limits how many requests run at once, so the rest wait in the queue. To see it, plot your TTFT against requests per second, and against queue depth if your server reports it. If the two rise together, the cause is load, so a retry only adds one more request to the same queue.
Recap#
- One scheduler iteration gives every running request one token, so your latency depends on what else is in the batch.
- Paging reserves only the memory a request needs now, so one GPU holds 253 requests instead of 14.