Prompt Caching Can Cost You 25% More
#810:33 video9 min readcoming soon
#prompt-caching#llm-cost#cache-hit-rate#anthropic-prompt-caching#openai-prompt-caching#kv-cache
Chapters
Each chapter opens the video at its time once the video is on YouTube.
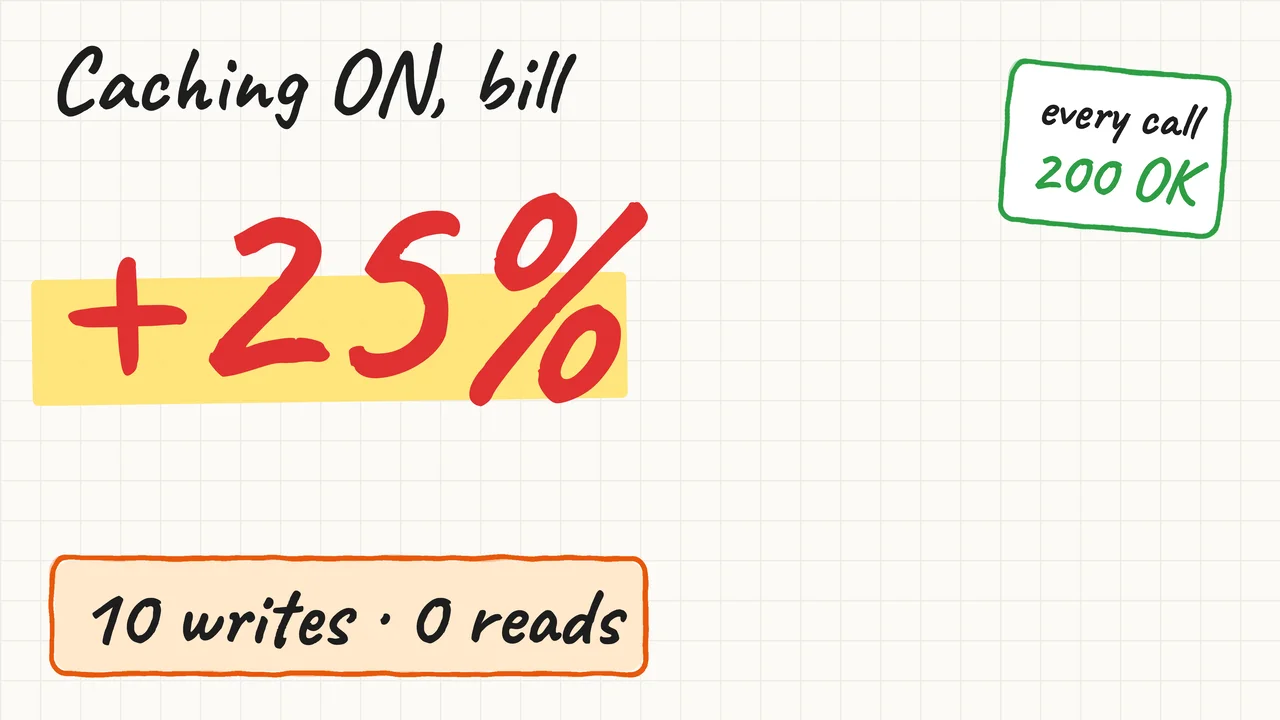
You turn on prompt caching for an agent that sends the same 12,000-token system prompt on every call. The input bill goes up by about 25%, and every call returned 200 OK. This video explains why, and which one number would have told you.
Read it instead
The full lesson in writing, with the diagrams from the video, for anyone who prefers to read.
Your support agent sends the same 12,000-token system prompt on every call, so you turn on prompt caching. Prompt caching stores the start of your prompt, so a call that repeats it pays less for it. Your next input bill is about 25% higher, not lower, and every call returned 200 OK. So why did caching cost you more, and which one number would have told you?
Three questions follow: when caching pays, what breaks a cache hit, and how you know it works.
1. When does caching pay?#
A cache entry is a purchase, because writing it costs more than plain input, so it pays only after enough reads.
The situation#
On Monday at 9:00 you ship a new system prompt, and a spike starts ten agent calls in one second. All ten start with the same 12,000 tokens of policy text, and caching is on.
The picture#
The prefix is the start of the prompt that repeats across calls, which here is your policy text. With caching on, the provider keeps its work on that prefix as a cache entry for later calls. Storing the entry is a cache write, and it costs 1.25 times the plain input price. A later call with the same prefix is a cache read, and it costs 0.1 times the input price. The entry lives for its TTL, its time to live, five minutes or one hour, and then the next call writes again.
Think it through#
On the five-minute tier, a write costs 1.25 times and a read 0.1 times. How many reads does one entry need before it saves money?
A first thought is several reads, because the write alone costs more than a whole plain call.
That is reasonable, because you pay extra up front, but each read saves far more than the write added.
So the real question is how many savings of 0.9 cover one surcharge of 0.25.
The mechanism, step by step#
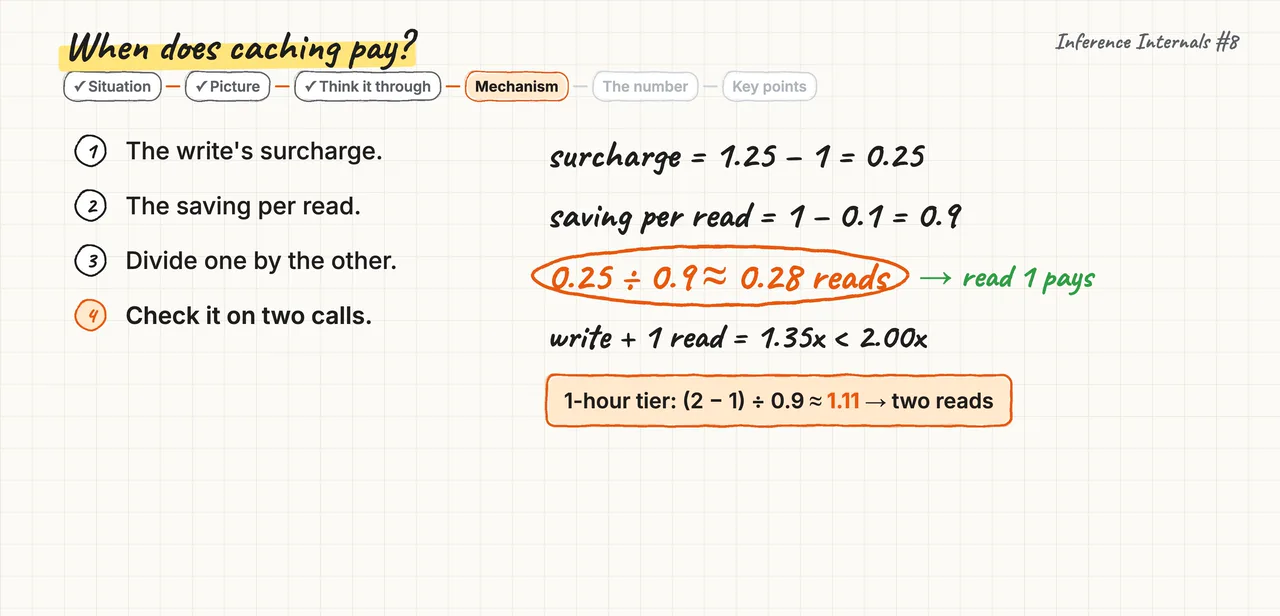
- A write costs 1.25 instead of 1, so it adds a surcharge of 0.25.
- A read costs 0.1 instead of 1, so each read saves 0.9.
- Divide the surcharge by the saving, and 0.25 divided by 0.9 is about 0.28 reads.
- Check two calls, where a write and one read cost 1.35 against 2.00 without caching. On the one-hour tier a write costs 2 times, so 1 divided by 0.9 is 1.11, and it needs two reads.
The number#
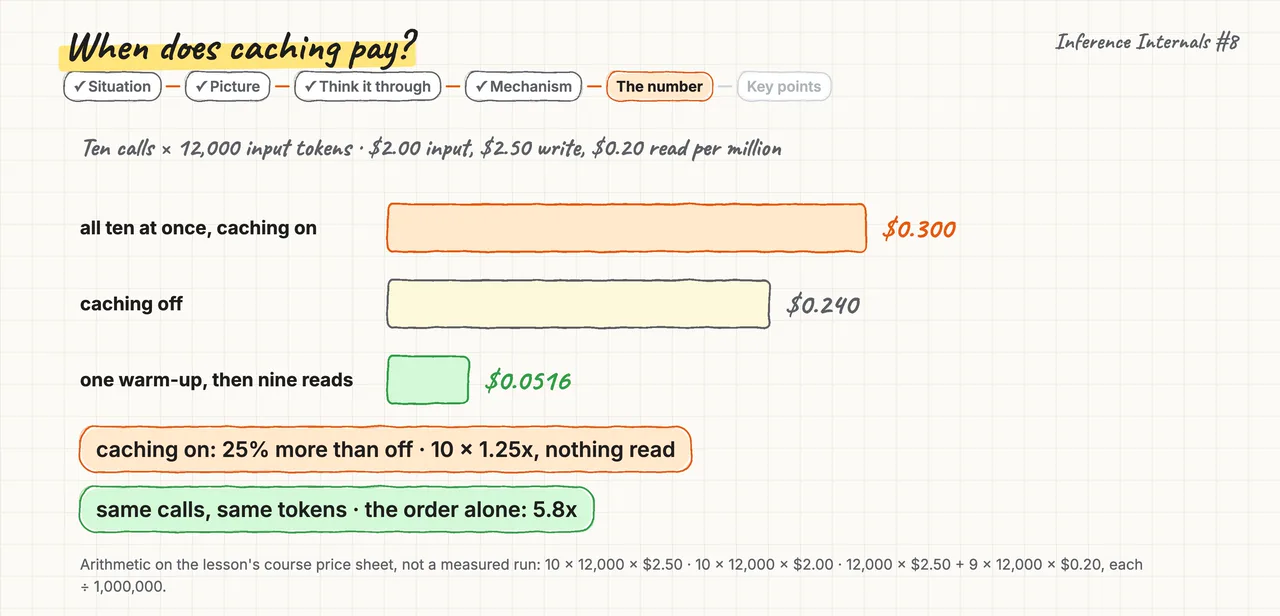
That break-even assumes the entry gets read, so go back to Monday's ten calls. A cache entry becomes usable only after the first response to it begins, and both providers document this. All ten calls start before any response begins, so all ten write and none of them reads. At $2.00 per million input tokens, the ten writes cost $0.300, so 25% more than $0.240 uncached. One warm-up call, then nine reads after its response begins, costs $0.0516, which is 5.8 times less.
Key points#
- Remember. A cache entry pays after (write − 1) ÷ (1 − read) reads inside its TTL.
- The trap. Believing caching is free to turn on, so every unread entry costs 1.25 times.
- Try this. Before a burst of same-prefix calls, send one warm-up call and wait for its first tokens.
You add the warm-up call, so Monday's burst now costs $0.0516 instead of $0.300. But a week later, ordinary calls still cost about 25% more than uncached ones, and all returned 200. The cause is the agent's notes block, which your prompt builder rewrites on every step and puts above the policy text.
2. What breaks a cache hit?#
Your cache hit rate is set by your prompt layout, because the cache compares bytes, not meaning.
The situation#
The notes block is the agent's working memory, and your prompt builder rewrites it on every step. It sits near the top of the prompt, above 12,000 tokens of policy text that never change.
The picture#
The cache matches your prompt byte for byte from the first token, and stops at the first byte that differs. So a notes block near the top ends the match early, and the policy below it is billed as new. With caching on, each call writes a fresh entry at 1.25 times, and no later call reads it. The hit rate is the share of input tokens billed at the read price, so yours is zero. The fix is layout, with stable content first and anything that changes per call in the last message.
Think it through#
Two back-to-back calls differ only in the order of their tool definitions. Does the second call hit the cache?
A first thought is yes, because both calls carry exactly the same tools and the same words.
That is reasonable, because to you the meaning is identical, but the cache never compares meaning, only bytes.
So the real question is which bytes the server compares, beyond the text you wrote.
The mechanism, step by step#
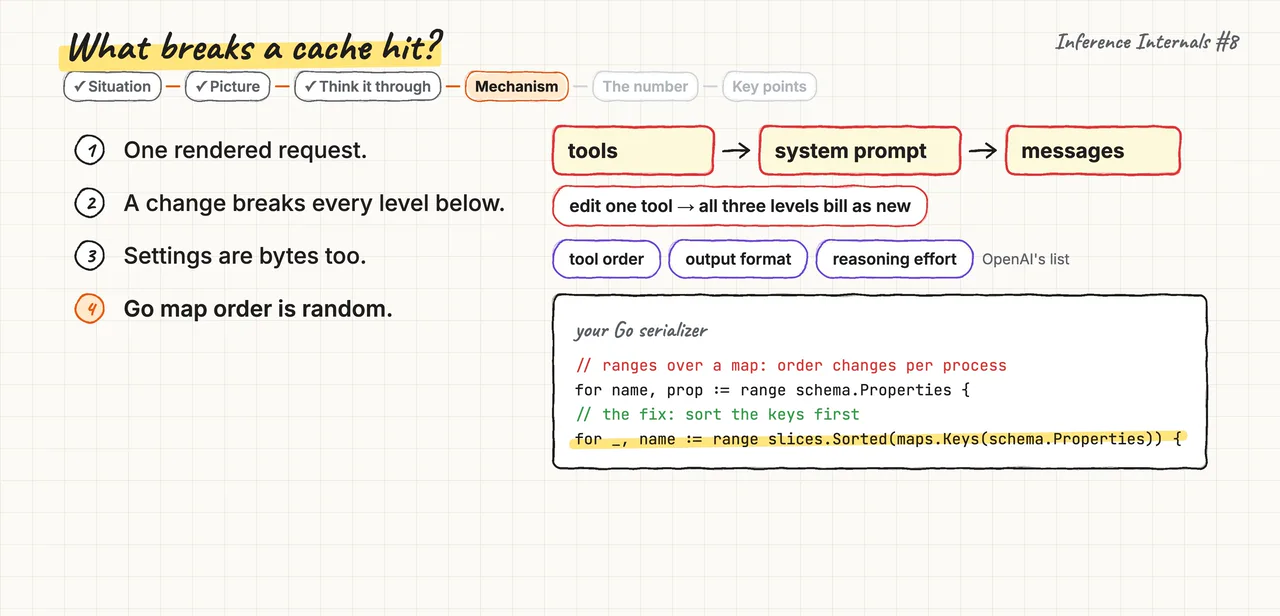
- The server sees one rendered request, with tools first, then the system prompt, then messages.
- A change at one level breaks every level below, so one tool edit costs the whole system prompt.
- Settings are rendered too, so on OpenAI the tool order, output format and reasoning effort must match.
- Go shuffles map order, so a hand-written loop over a map writes JSON keys differently per pod. Sorting the keys first makes every pod send the same bytes.
The number#
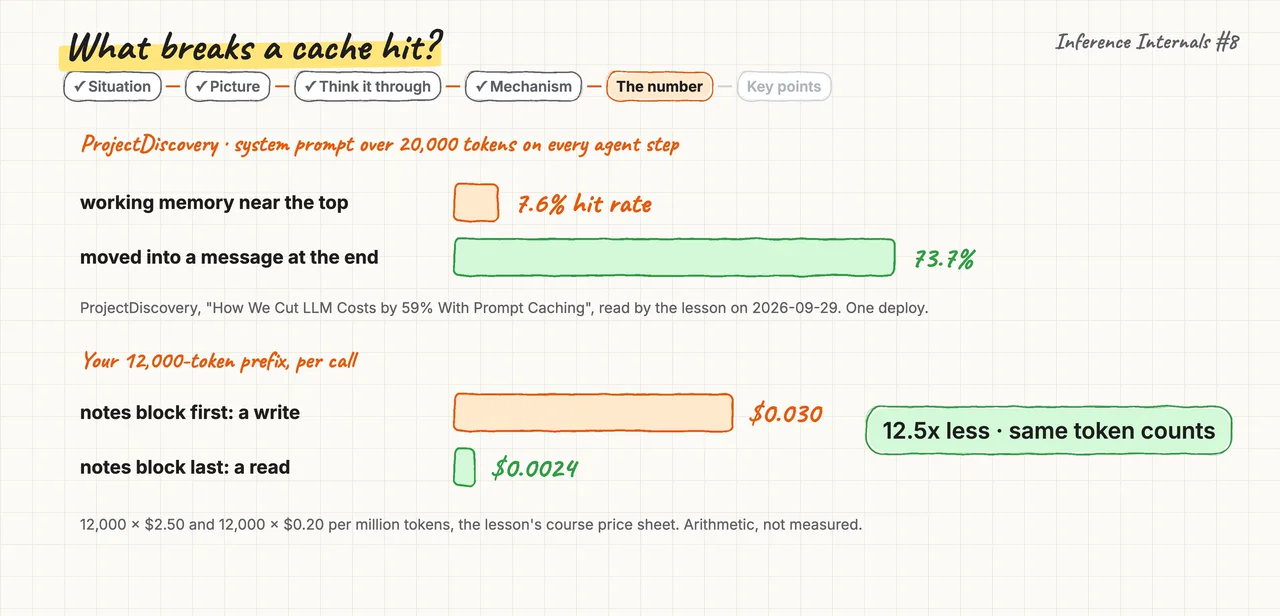
ProjectDiscovery found the same cause, with a system prompt of over 20,000 tokens on every agent step. It kept the agent's working memory near the top, and its hit rate was 7.6%. Moving that memory into a message at the end raised it to 73.7% in one deploy. On your 12,000-token prefix, the same move turns a $0.030 write into a $0.0024 read. That is 12.5 times less per call, with exactly the same token counts.
Key points#
- Remember. The hit rate is a property of your layout, so stable bytes first and changing content last.
- The trap. Two requests with the same meaning can differ in tool order, settings or key order.
- Try this. Diff the rendered requests of two calls, and find the first byte that differs.
You move the notes block into the last message, so the policy text becomes the first bytes of every call. Your calls returned 200 OK before the move and after it, and your error monitor stayed quiet. Your token dashboard stayed flat too, so nothing you watch shows whether the cache works now.
3. How do you know it works?#
A broken cache returns success, so the cached-token count in the usage object is the only proof.
The situation#
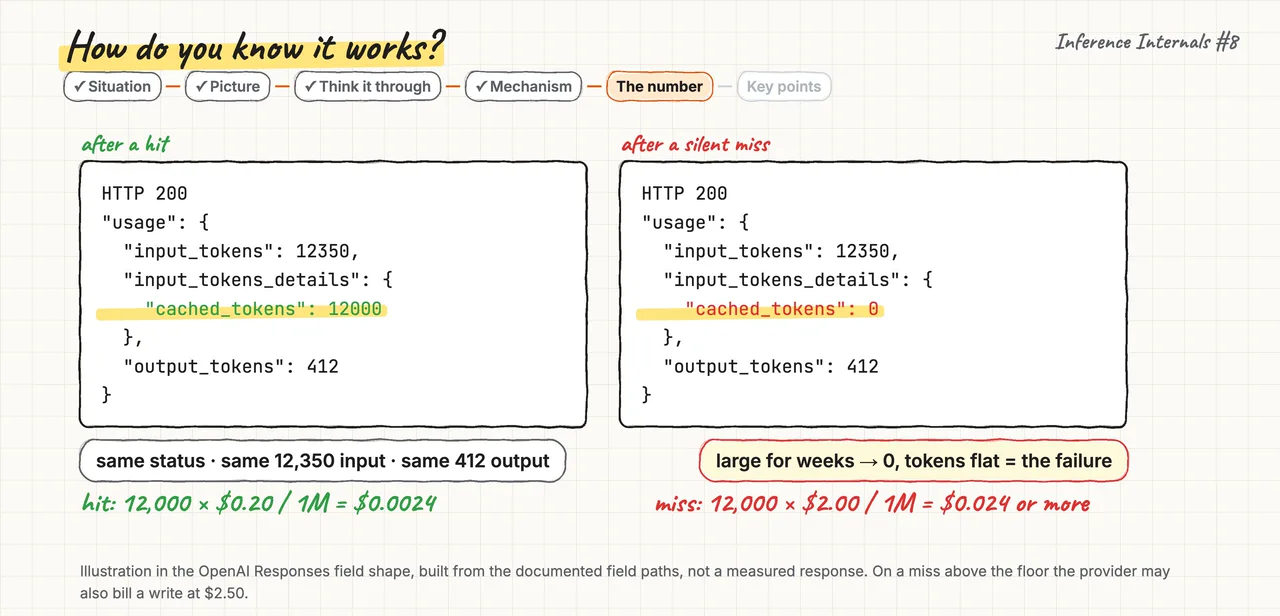
Before and after the move, each call returned status 200, the same finish reason and the same token total. The usage object, the token counts returned with each response, is the only part that can differ.
The picture#
A cache also has a floor, the minimum cacheable length, the shortest prefix the provider will store. On Anthropic that floor runs from 512 to 4,096 tokens, depending on the model. Below the floor, the provider bills the whole prompt at full price and returns success with no error. Above the floor with a changed prefix, it writes a new entry instead of reading, and also returns success.
Think it through#
You mark an 800-token prefix with cache_control, the marker that asks Anthropic to store it. Both calls return 200 OK, so were you cached?
A first thought is yes, because the provider accepted the marker and returned no error.
That is reasonable, because a bad request usually fails, but a prefix below the floor is normal to the provider.
So the real question is which field shows whether the second call read the cache.
The mechanism, step by step#
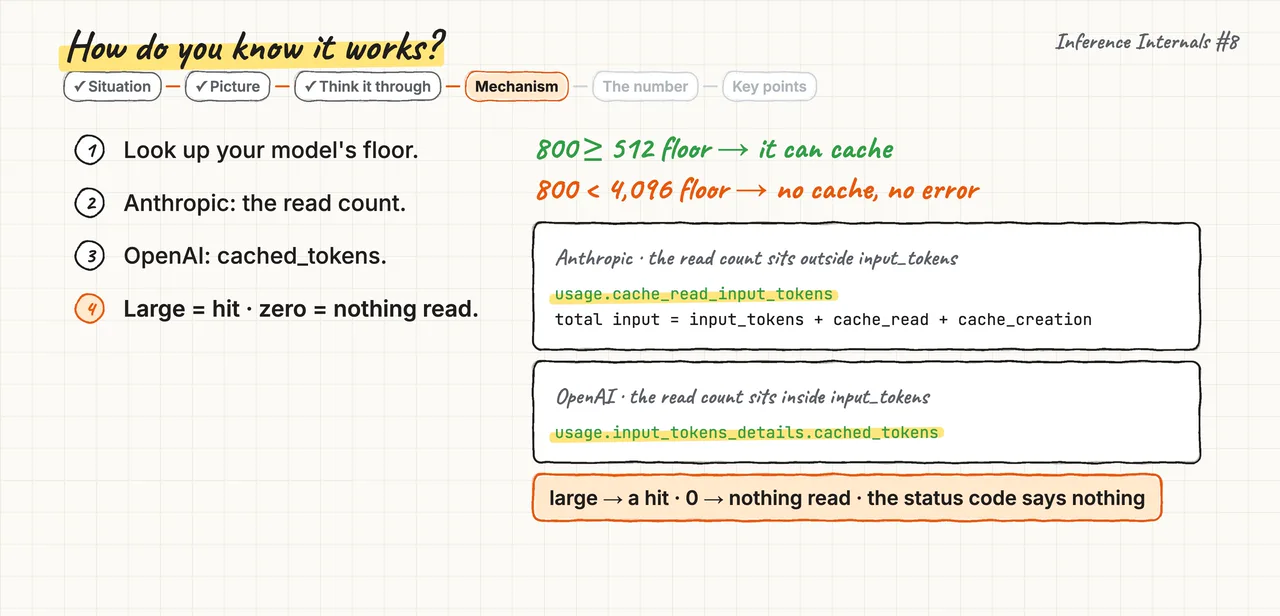
- Look up your model's floor, because 800 tokens clears a 512 floor but not a 4,096 floor.
- On Anthropic, read cache_read_input_tokens on the second call, a field outside input_tokens.
- On OpenAI the count is cached_tokens, inside input_tokens, so the total never moves.
- A large count proves a hit, and zero proves nothing was read, whatever the status code says.
The number#
Here are two OpenAI-style responses for one call, after a hit and after a silent miss. Both show status 200, the same 12,350 input tokens and the same 412 output tokens. Only the cached count differs, with 12,000 on the hit and 0 on the miss. So the hit bills those 12,000 tokens at $0.0024, and the miss at $0.024 or more. A count that reads large for weeks and then zero, while token counts stay flat, is the failure signal.
Key points#
- Remember. A broken cache returns 200 OK, so the cached-token count is the only proof.
- The trap. Believing a broken cache would show up as errors, which your error monitor never sees.
- Try this. Log the cached count of every call, and alert when it stays at zero.
So caching cost you more because every write was paid and none was read, and a 200 never shows that. Caching pays when entries get more reads than the break-even inside the TTL, like a fast tool loop. A chat with ten-minute pauses outlives a five-minute entry, so it needs the hour tier and two reads an hour. You keep the hit with stable bytes first, fixed tool order, sorted keys and a warm-up before each burst. And the one number to watch is the cached-token count on every call, the only proof the cache paid.
Recap#
- A cache entry is a purchase, so it pays only after (write − 1) ÷ (1 − read) reads inside its TTL.
- The hit rate is a property of your layout, so stable bytes go first and changing content goes last.
- A broken cache returns success, so the cached-token count in the usage object is the only proof.
Sources#
- Anthropic prompt caching docs (multipliers, TTLs, minimums, invalidation order, the availability rule)
- OpenAI prompt caching guide (usage cost formula, 1,024-token minimum, settings that break a match)
- ProjectDiscovery, "How We Cut LLM Costs by 59% With Prompt Caching" (hit rate 7.6% to 73.7%), as cited in the lesson
- Langfuse issue #13807 (a $0.52 run shown as $0.24)